xGen™ Normalase™ Module
Revolutionary normalization technology for NGS libraries
This fast and automatable workflow improves cluster density and library balance and can easily be integrated into your standard DNA and RNA library preparation protocols for research studies to increase efficiency and reduce cost for NGS research laboratories.
xGen™ NGS—made to streamline.
Ordering
- Save time and increase throughput: Uniform sampling with fewer handling steps to generate balanced library representation for multiplexed sequencing of research samples.
- Reduce sequencing costs: Improve library balancing, allow higher multiplexing per run and obtain predictable read numbers.
- Flexible design: Compatible with diverse DNA and RNA library preparation methods to produce more evenly balanced sequence data.
- Simple, 45-min protocol
- Workflow design for easy high-throughput research sample processing (automation systems)
Transform Your NGS Workflow with Automation
Looking to streamline your NGS workflows? Discover how automation can enhance efficiency and consistency in your lab with our NGS Automation solutions.
Product details
The xGen Normalase Module offers a novel enzymatic library normalization technology that consolidates DNA or RNA library normalization and pooling for loading on Illumina® systems in research studies. The Normalase workflow eliminates the need for library concentration adjustment prior to library pooling, improving cluster density and library balance.
The xGen normalization method can easily be integrated into standard library preparation protocols to improve turnaround time and loading accuracy for NGS laboratories. The library selection and enzymatic normalization steps of the Normalase workflow (Figure 1) are designed for research workflows that consistently produce amplified library yields 3x the target normalization amount following library amplification with Normalase primers. For example, ≥6 nM or ≥12 nM yield in 20 μl volume achieves 2 nM or 4 nM normalized library yield; a ≥6 nM normalization workflow will result in a 2 nM final normalized library pool, which can be concentrated to achieve 4 nM.
This workflow does not introduce a second PCR; instead, it replaces the primers in conventional library amplification, either terminal or indexing. The xGen Normalase Kits offer a fast, scalable library normalization workflow for high-throughput research laboratories.
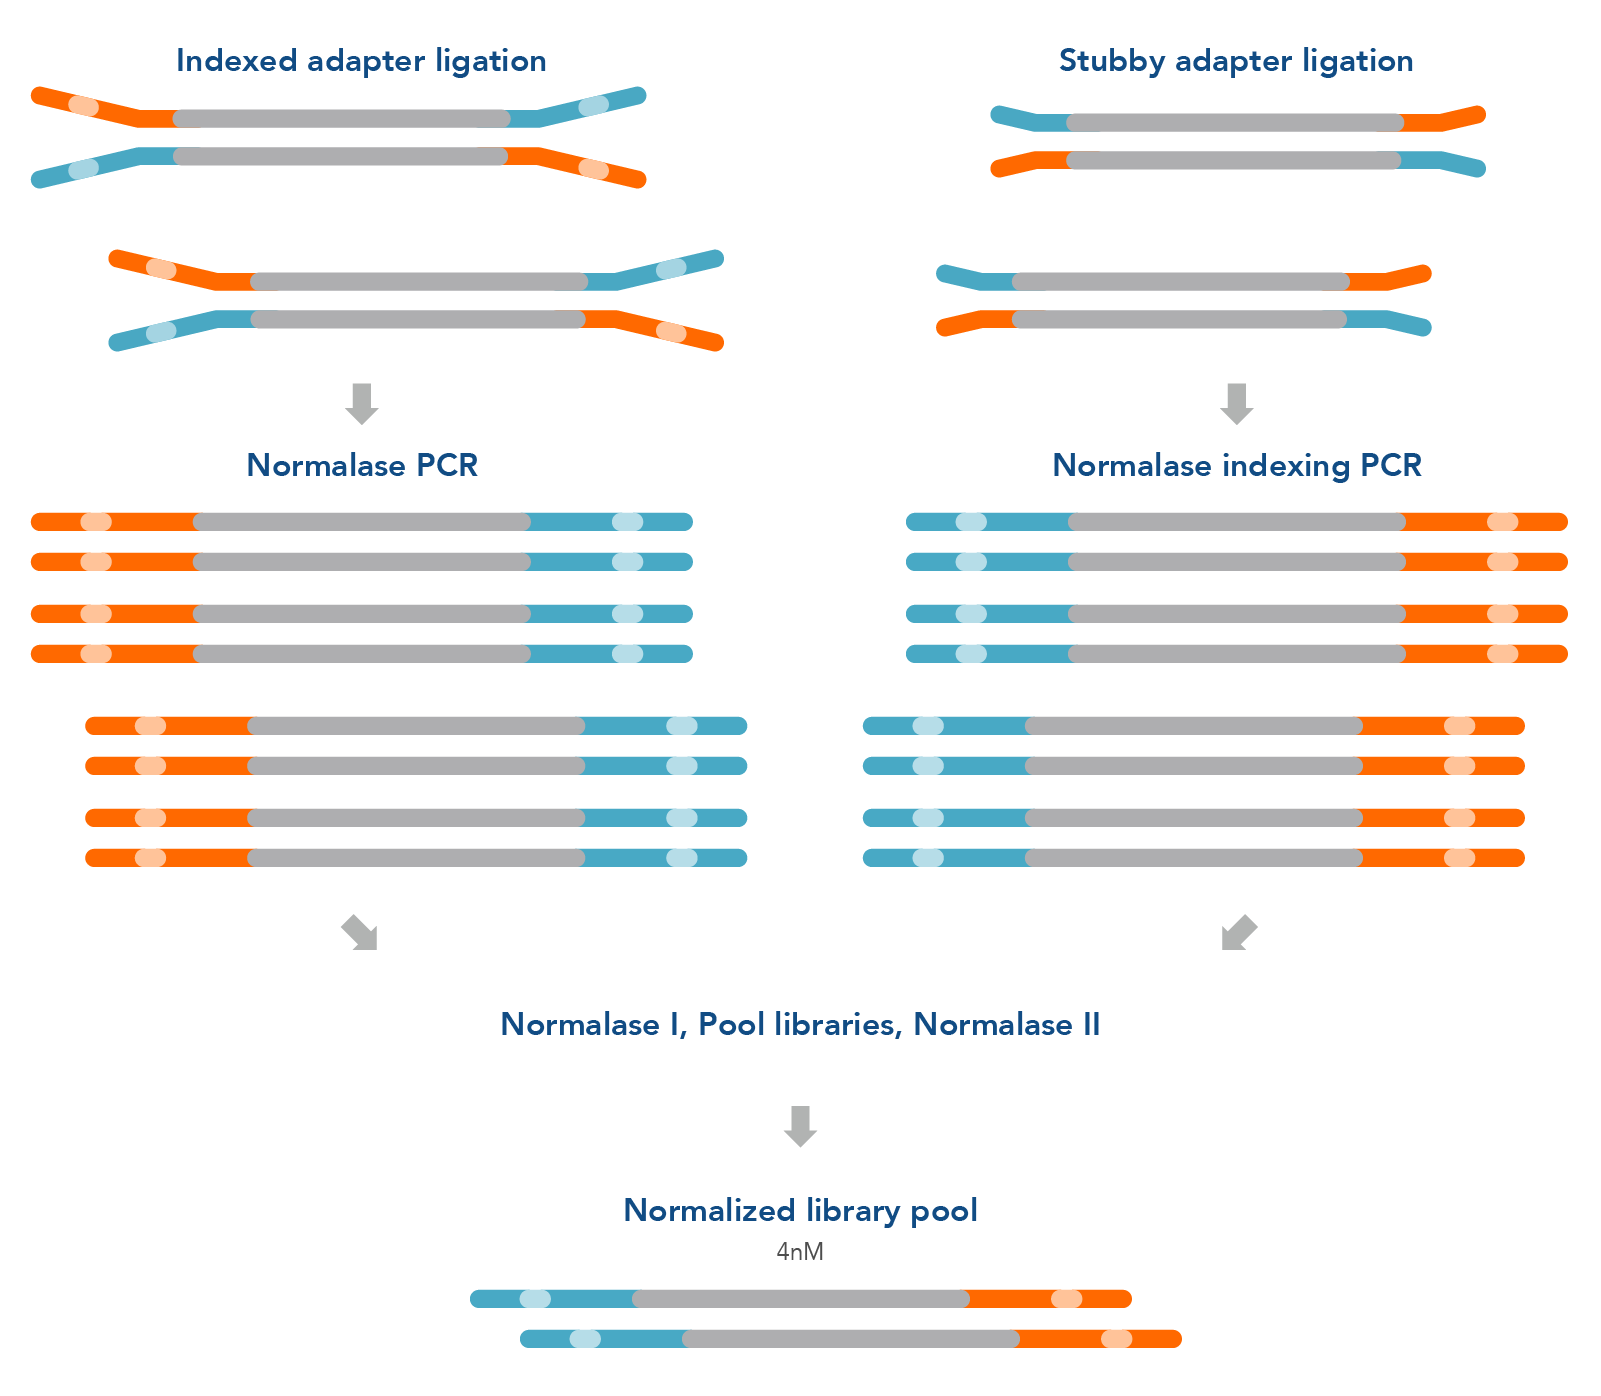
Figure 1. Normalase research workflow. The xGen Normalase research workflow begins after NGS library adapter ligation, using either full-length indexed adapters or truncated adapters, where Normalase PCR primers are used to amplify the libraries to above the minimum threshold and condition the libraries for downstream Normalase enzymology. For full-length indexed adapter libraries, xGen Normalase terminal primers are used; for truncated adapter libraries, xGen Combinatorial Dual Indexing Normalase primers are used. Amplified and conditioned NGS libraries are then individually incubated for 15 minutes with the Normalase I Master Mix to enzymatically select a specified molarity of each NGS library. After Normalase I, each library is pooled using equal volumes into a single tube and incubated for 15 minutes with the Normalase II Master Mix which enzymatically normalizes each NGS library to the specified selected molarity. The result of Normalase is a balanced, multiplexed NGS library pool ready for sequencing.
** ≥6 nM normalization workflow will result in a 2 nM final normalized library pool, which can be concentrated to achieve 4 nM. **
Product data
Consistent DNA library normalization and reliable results across variable insert sizes
| Loading (pM) | Cluster density (K/mm2) | # of libraries | Library balance (CV%) | Insert size (bp) |
|---|---|---|---|---|
| 12 | 1370 | 6 | 9.7 | 150 |
| 12 | 1043 | 16 | 8.2 | 200 |
| 12 | 1157 | 6 | 5.4 | 350 |
| 12 | 1070 | 5 | 3.7 | 600 |
Table 1. Expected and consistent cluster density generation using MiSeq® V2 chemistry at 12 pM from library pools normalized to 4 nM using Normalase.
Better normalization compared to conventional methods
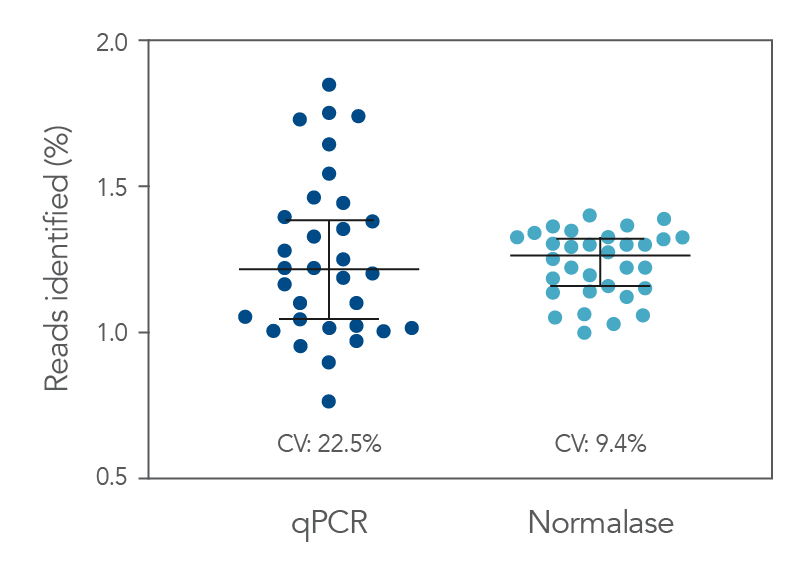
Figure 2. qPCR vs. Normalase. Thirty-two xGen DNA libraries were generated with full-length indexed adapters between two users (n=16/user) with 1-250 ng inputs of NA12878 gDNA. Post-Normalase PCR libraries were quantified with qPCR assuring the libraries met the minimum threshold. Libraries were either normalized and pooled and sequenced based on the qPCR quant or, using the same libraries, pooled and normalized using Normalase and sequenced to determine percent Reads Identified of each index (MiSeq V2 50 cycle Nano). The coefficient of variation (CV) for the qPCR pool was 22.5% across the two users, while the CV for the Normalase pool was 9.4%. Lines are median and 95% confidence interval.
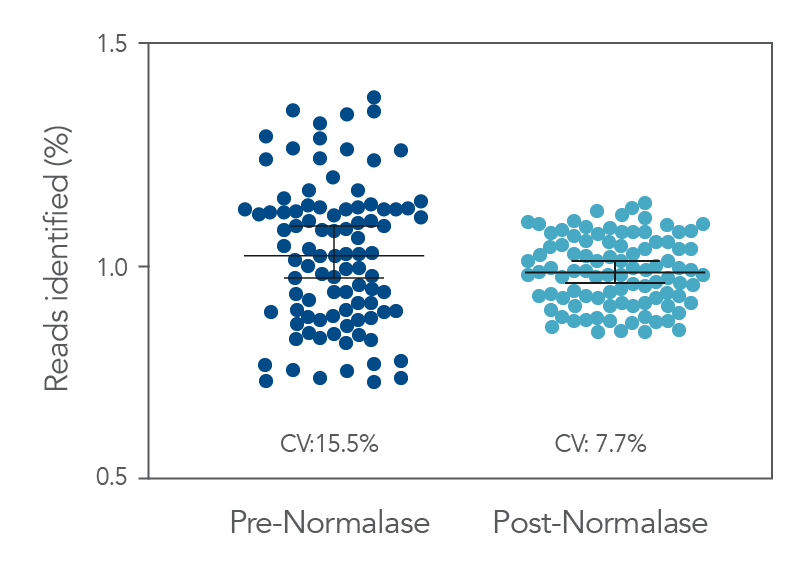
Figure 3. Pre- vs. Post-Normalase. Ninety-six xGen DNA libraries were generated with 10 ng NA12878 gDNA and amplified with xGen Normalase Combinatorial Dual Indexing primers. Libraries were pooled, Pre-Normalase, using
equal volumes and the pool quantified by QubitTM (Thermo Fisher) for loading on the IlluminaTM MiSeqTM V2 50 cycle Nano flow cell to obtain percent Reads Identified from each index. The Pre-Normalase pool
CV was 15.5%, demonstrating robust and consistent amplification using the Normalase Indexing primers. The same libraries were subjected to Normalase and normalized to 4 nM, Post-Normalase, and loaded on the IlluminaTM MiSeqTM V2 50 cycle Nano flow cell. The Normalase pool CV was reduced to 7.7% showing robust normalization of multiplexed library pools using xGen Normalase. Lines are median and 95% confidence interval.
Better library normalization compared to conventional methods
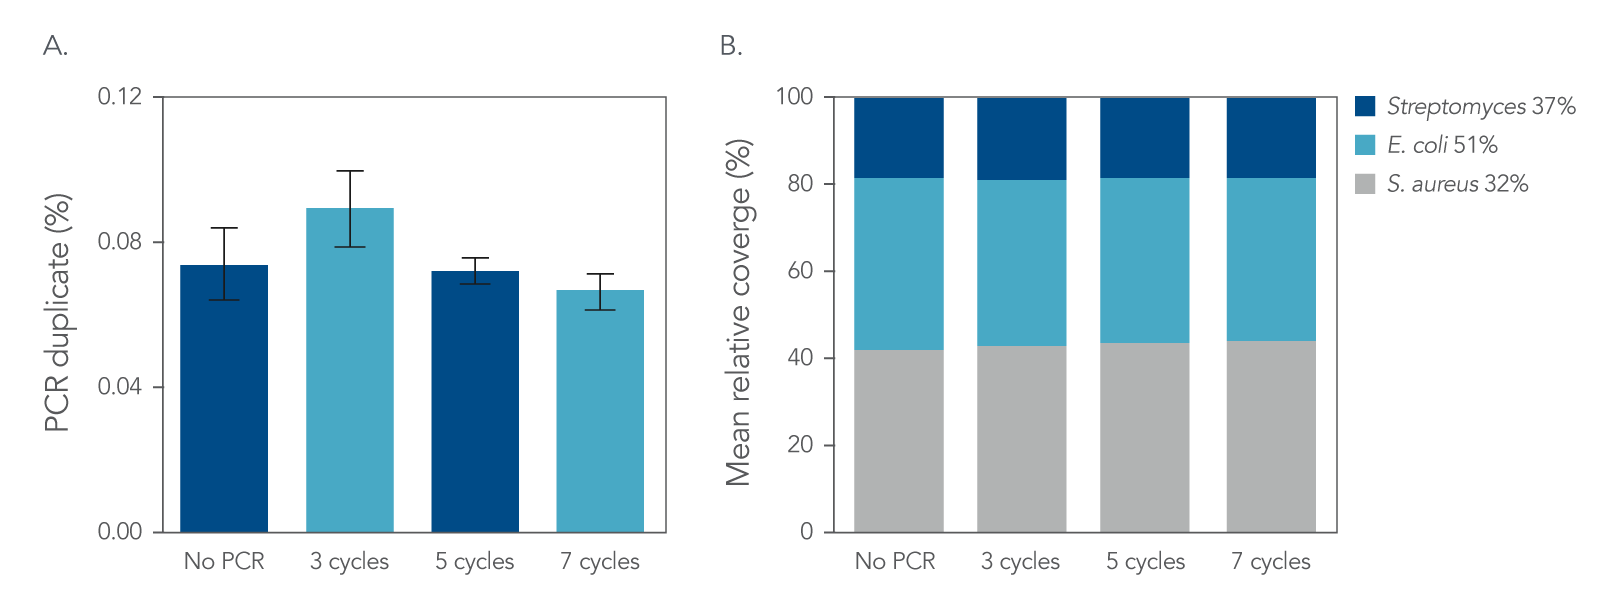
Figure 4. Normalization. IDT xGen DNA libraries were made from 100 ng of DNA consisting of a mix of three reference bacterial strains (E. coli, S. aureus, Streptomyces) mixed at unequal proportions. DNA fragmented to 350 bp was ligated with full-length indexed Y-adapters, and was either not amplified or amplified using 3, 5, and 7 cycles of PCR using IDT HiFi Polymerase and Normalase terminal primers. All libraries were quantified and pooled based on their qPCR quantification. Libraries were sequenced on a MiSeqTM instrument (Illumina) using PE150 sequencing. Across bacterial genomes with varying GC% content, there was no observed difference in A) the number of read duplicates, or B) genome coverage.
Libraries normalized using Normalase maintain high quality sequencing coverage
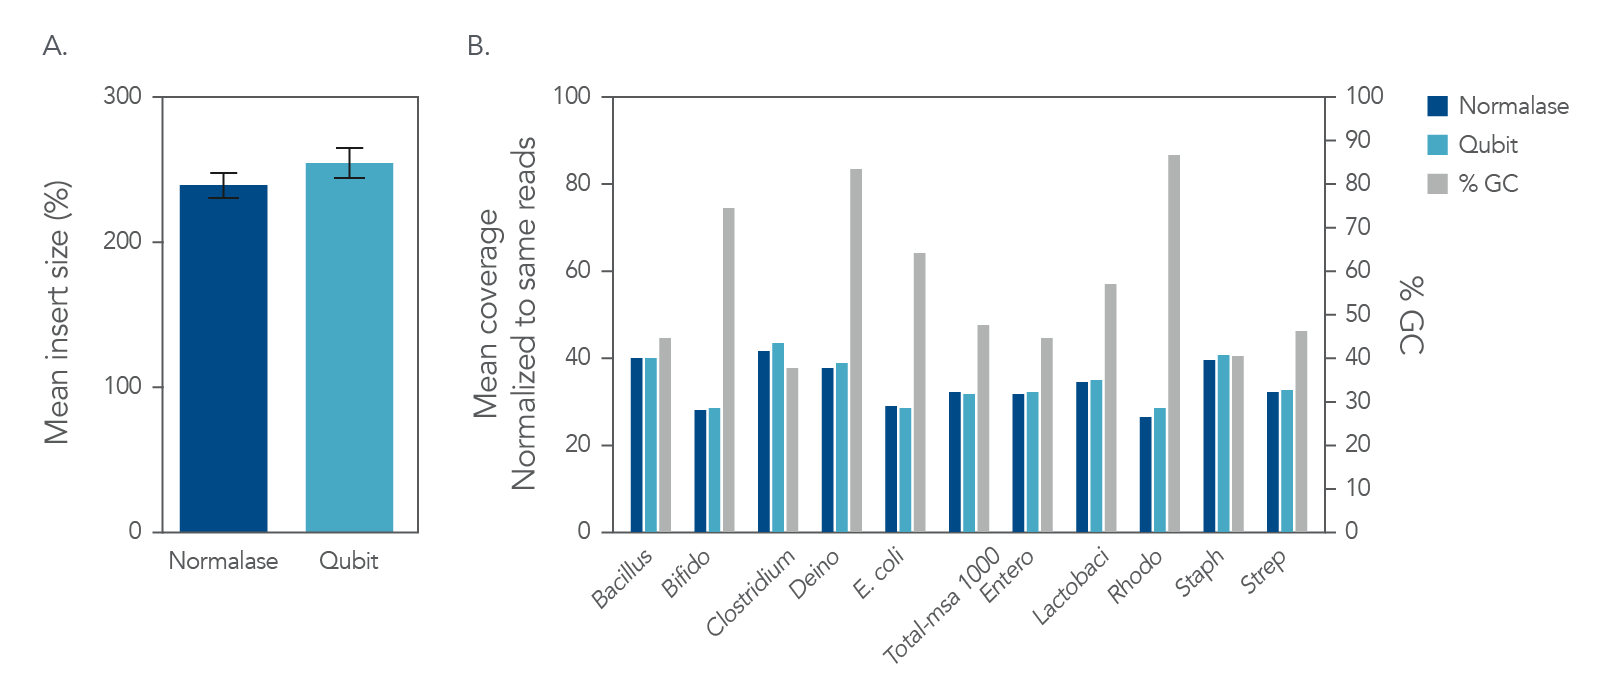
Figure 5. Insert size and coverage. The xGen DNA libraries were made from 5 ng of MSA-1000-an equal mass mix of 10 different bacterial strain genomes with varying GC%. Two libraries were either amplified and indexed with xGen CD Indexing Normalase primers (plum) or IDT CD Indexing primers (blue). Normalase conditioned libraries were normalized to 4 nM and pooled using Normalase, while standard libraries were QubitTM (Thermo Fisher) quantified and pooled at 4 nM. Libraries were co-sequenced on a MiniSeqTM (Illumina) using High Output reagents and PE150 sequencing. Across bacterial genomes with varying GC% libraries, Normalase-treated libraries maintained A) insert size and B) high quality genomic coverage.
Normalase preserves RNA-Seq data quality
To study RNA-Seq data quality (Table 2), four xGen RNA libraries were generated from 50 ng human brain mRNA, amplified, and indexed with either xGen Combinatorial Dual (CD) Indexing primers (n=2), or xGen Combinatorial Dual Indexing Normalase primers (CDI-N), using nine cycles of PCR and IDT HiFi Polymerase. CD libraries were pooled and normalized manually using library quants from the qPCR, while CDI-N libraries were subjected to Normalase up to 4 nM. The two pools were combined and sequenced on a MiniSeqTM (Illumina) High Output (2x150) run. Sequencing data were normalized to 4,011,853 paired-end reads, mapped using STAR, and analyzed for RNA-Seq metrics using Picard (Table 3).
Table 2. RNA-Seq data quality analysis.
| Sample Pooling | Exonic Rate (%) | Intronic Rate (%) | Unique Rate of Mapped (%) | Duplication Rate (%) | Estimated Library Size | Transcripts Detected | Genes Detected | Fragment Length Mean (bp) | Strandedness (%) |
|---|---|---|---|---|---|---|---|---|---|
| qPCR | 54.57 | 36.22 | 95.50 | 4.50 | 41,387,519 | 94,895 | 17,061 | 162 | 97.33 |
| qPCR | 54.56 | 36.23 | 95.48 | 4.52 | 41,228,061 | 94,960 | 17,129 | 161 | 97.31 |
| Normalase | 54.50 | 36.32 | 95.58 | 4.42 | 42,333,797 | 94,608 | 17,091 | 159 | 97.28 |
| Normalase | 54.49 | 36.34 | 95.57 | 4.43 | 42,208,180 | 94,711 | 17,107 | 158 | 97.28 |
Table 3. Coverage metrics of the top 1000 expressed transcripts showing no differences between qPCR manual pooling and Normalase.
| Sample | Mean Per Base Cov. | Mean CV | No. Covered 5' | 5' 200 Base Norm | No. Covered 3' | 3' 200 Base Norm | Num. Gaps | Cumul. Gap Length | Gap % |
|---|---|---|---|---|---|---|---|---|---|
| qPCR | 273.90 | 0.90 | 860 | 0.27 | 948 | 0.45 | 669 | 63701 | 4.65 |
| qPCR | 278.39 | 0.90 | 864 | 0.26 | 954 | 0.45 | 639 | 62079 | 4.68 |
| Normalase | 277.33 | 0.91 | 859 | 0.26 | 944 | 0.45 | 661 | 64419 | 4.82 |
| Normalase | 275.19 | 0.91 | 866 | 0.27 | 944 | 0.45 | 650 | 61794 | 4.58 |
Specifications
| Feature | xGen Normalase Module |
|---|---|
| Post-library amplification molarity required prior to Normalase | 3x target molarity in 20 µL |
| Normalized concentration Post-Normalase | 4 nM (or 2 nM when using ≥ 6 nM normalization workflow option) |
| Library compatibility |
|
| Library balance within a pool | Coefficient of variation ≤ 10% |
| IDT indexing compatibility | xGen Adapters xGen Normalase Combinatorial Dual Indexing Primers xGen Normalase Unique Dual Indexing Primers |
| System compatibility | Consistent results across Illumina sequencing instruments |
Resources
Frequently asked questions
What are the new names of the Swift products?
The Swift products were rebranded and now belong to the xGen™ NGS product line. The following lists the old Swift product name, and then the new name hyperlinked to its current product page.
| Swift product name | New IDT product name |
|---|---|
| Accel-NGS® Adaptase® Module for Single-Cell Methyl-Seq | xGen Adaptase™ Module |
| Normalase® Amplicon Panels (SNAP) Core | xGen Amplicon Core |
| SARS-CoV-2 Additional Genome Coverage Panel | xGen SARS-CoV-2 Expanded Amplicon Panel |
| SARS-CoV-2 S Gene Panel | xGen SARS-CoV-2 SGene Amplicon Panel |
| SNAP Set 1A Combinatorial Dual Indexing Primers | xGen Amplicon CDI Primers |
| Swift Combinatorial Dual Indexing Primers | xGen CDI Primers |
| Swift Normalase® Combinatorial Dual Indexing Primers | xGen Normalase CDI Primers |
| Accel-NGS 1S Plus DNA Library | xGen ssDNA & Low-input DNA Library Prep |
| Swift 2S Sonic DNA Library | xGen DNA Library Prep MC |
| Swift 2S Sonic Flexible DNA Library | xGen DNA Library Prep MC UNI |
| Swift 2S Turbo v2 | xGen DNA Library Prep EZ |
| Swift 2S Turbo Flexible v2 DNA Library | xGen DNA Library Prep EZ UNI |
| Accel-NGS Methyl-Seq DNA Library | xGen Methyl-Seq Library Prep |
| Swift Normalase | xGen Normalase Module |
| Swift Rapid RNA Library | xGen RNA Library Prep Kit |
| Swift RNA Library | xGen Broad-Range RNA Library Prep |
What is the shelf life of the xGen™ Normalase™ Module?
What is the library yield requirement for expected functionality with the Normalase™ Module?
Obtaining a minimum threshold of 6 nM or 12 nM in a 20 µL volume after Normalase PCR, depending on the chosen workflow option, is required for expected functionality. Libraries that do not meet this threshold will be less than 2 nM or 4 nM post-Normalase Module (from 6 nM or 12 nM minimum thresholds, respectively) and will be under-represented during cluster generation.
Also, if multiple libraries are under 12 nM to start, the final library pool will be less than 4 nM, resulting in potential under-clustering of the pool on the flow cell. This is similarly the case for the 6 nM normalization workflow, where the final library pool will be less than 2 nM resulting in under-clustering of the pool on the flow cell.
What is the Normalase™ Module?
The Normalase™ Module is an enzymatic normalization tool for multiplexing next generation sequencing (NGS) libraries with equimolar pooling, resulting in balanced sample representation on Illumina sequencing runs.
By eliminating the need for library concentration adjustment before library pooling, Normalase offers a fast workflow for generating pooled libraries with balanced representation.
Which insert sizes are appropriate to use with the Normalase™ protocol?
The best results are obtained by using libraries with similar median insert sizes (i.e., 200−350 bp inserts), as measured by fragment analysis.
Libraries with broad or variable size distribution (i.e., transposase-based workflows) that demonstrate size-dependent clustering effects on Illumina sequencers, and are independent of molarity, may have more variable results.
Which HiFi polymerases are compatible with Normalase™ PCR?
The xGen™ Normalase Module has been tested by IDT with these high-fidelity polymerases:
- Takara PrimeStar GXL polymerase
- KAPA HiFi HotStart ReadyMix
- NEBNext Ultra II Q5® Master Mix
What causes variation of read counts (CV > 10%) among libraries within Normalase™ pools?
There are several causes for this which may include:
- Libraries not meeting the 6 nM or 12 nM minimum threshold in 20 µL library yield
- Sequencer overloading and subsequent over-clustering resulting in low sequencing quality
- Inconsistent pipetting of Normalase™ I Master Mix into individual libraries
- Inconsistent pipetting of individual libraries into pools before Normalase II
Each of these conditions could introduce more variability and increase variation of read counts to >10%.
Check that your libraries meet the minimum threshold of 6 nM or 12 nM in a 20 µL library yield for optimal performance.
Note: Quantify problematic libraries before pooling to confirm suggested molarity. Use a P10 pipette if available, and ensure pipetting equipment is maintained and calibrated.
What are the supported library preparation workflows for the xGen™ Normalase™ Module?
Our Normalase™ Module is compatible with the following xGen library prep kits:
- xGen™ DNA Library Prep Kit MC
- xGen DNA Library Prep Kit MC UNI
- xGen DNA Library Prep Kit EZ
- xGen DNA Library Prep Kit EZ UNI
- xGen RNA Library Prep Kit
- xGen Broad-range RNA Library Prep Kit
- xGen ssDNA & Low-Input DNA Library Prep Kit*
- xGen Methyl-Seq Library Prep Kit*
* Due to the nature of the samples and inputs used with these kits (which tend to be challenging), the libraries prepared by these kits have a higher risk of not meeting the yield requirement necessary to use the Normalase Module.
Is there a minimum or maximum limit to the number of samples that can be combined into a single Normalase™ pool?
No, there is not a minimum or maximum limit to the number of sample libraries that can be combined into a single Normalase™ pool. However, consider your desired number of reads for each sample and only pool together those samples that have the same required read counts.
Also, consider index compatibility as well as insert size. Pool libraries of comparable insert sizes that can be co-sequenced to avoid size dependent clustering effects that are independent of molarity and can lead to higher variation of sample representation in the sequencing data.
Note: Do not pool libraries with index combinations that have not been validated by the supplier or risk demultiplexing errors and loss of data.
Is library amplification required when using the Normalase™ Module?
Yes, libraries must be amplified and conditioned with Normalase™ primers. Even if library yields have met the 6 nM or 12 nM minimum threshold before PCR amplification, a minimum of 3 cycles is required to condition the library for downstream enzymology. The Normalase Module allows you to maintain your conventional library amplification reagents, except for any amplification primers.
For indexing by ligation, use Reagent R5 for Normalase PCR in place of conventional amplification primers and see Appendix: Section C in the protocol for recommended minimum PCR cycles.
For indexing by Normalase PCR, use Reagent R6 for Normalase CDA or Reagent R7 for Normalase UDI. Normalase indexing primers complete the adapter sequence as well as amplify and condition libraries for downstream Normalase steps. See Appendix: Section C for minimum cycling as the use of Normalase indexing primers requires more cycles compared to conventional indexing primers.
Note: You can refer to the xGen™ Normalase™ Module Protocol and the specific xGen™ library preparation protocols for minimum cycle recommendations.
Does the Normalase™ Module protocol support library long-term storage?
Final pools post-Normalase™ Module inactivation contain single-stranded DNA and can be stored at –20ºC for up to four weeks before sequencing.
For longer term storage, safe stopping points are recommended following post-library amplification purification and post-Normalase I reaction.
Does the Normalase™ Module replace post-PCR library quantification?
No, rather the Normalase™ Module replaces the steps of variable volume library pooling, or library concentration adjustment, before pooling.
The use of the Normalase Module removes the need for relative quants and fragment analysis to normalize and pool libraries based on calculated molarities.
Do I need library quantification after amplification and before Normalase™ I enzyme?
No, it is not necessary to quantify libraries before Normalase™ I enzyme if the libraries are all known to meet the 6 nM or 12 nM yield threshold. For example, if your library preparation and your standard nucleic acid sample inputs consistently yield 20 nM, quantification can be skipped.
Quantification is only required when library yields are unknown, and potentially when they are under the 6 nM or 12 nM minimum threshold.
For quality control purposes, we recommend quantifying libraries after Normalase PCR using a validated qPCR assay or fluorometric quantification assay.
Can I analyze Normalase™ pools using fluorometric methods such as Bioanalyzer™ or Qubit™?
No, the xGen™ Normalase™ Module produces single stranded libraries that are not measurable via fluorometric or fragment analysis.
We recommend quantifying by qPCR and running Bioanalyzer (Agilent) post-library amplification to obtain library traces for fragment analysis and for quality control purposes.
Are there specific recommendations for alternative pooling strategies?
Yes, for low-plex pooling (<5 libraries) follow the recommendations provided in Appendix A of the xGen™ Normalase Module Protocol.
If you have a higher volume of the final pool than the volume produced by the standard protocol (5 µL/sample), follow the recommendations provided in Appendix B. These pooling recommendations can help with sequencing on a NovaSeq® and the capability to load a single pool over multiple lanes or flow cells.
Are there any safe stopping points in the Normalase™ Module protocol?
Yes, there are two safe stopping points:
- After Normalase PCR and bead-based cleanup, libraries eluted in low EDTA TE can be stored at –20°C.
- After Normalase I incubation, libraries can be stored at –20°C.
Can I use my own library amplification primers or indexing amplification primers for Normalase™ PCR?
No, Normalase PCR requires replacing your amplification primers to condition your libraries for the downstream enzymology. Reagent R5 replaces standard library amplification primers for those libraries indexed by adapter ligation.
Reagent R6 with xGen™ Normalase CDI primers, or Reagent R7 with Normalase UDI primers, replace your indexing primers for libraries indexed by PCR.
